Previously I wrote why I decided to measure the air quality in my neighborhood. Now I will focus on a technical aspect of the a PM sensor.
Firstly I had to choose the air quality sensor. Based on opinions and prices I chose the PMS3003. Additionally I assumed that the sensor will be sending a data using a WiFi connection. Since I had some experience in using WiFi modules, that’s why i took an ESP module.
Parts
If I do not care about delivery time I buy electronics on AliExpress. Delivery usually takes about 14-30 days, but prices are really low.
- PMS3003 – a laser dust PM1.0, PM2.5 and PM10 sensor with built-in fan
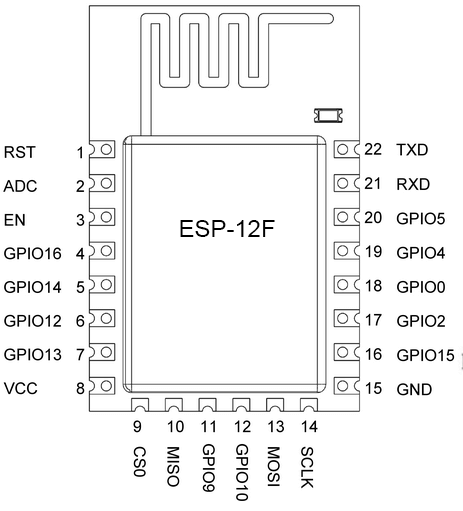
- ESP-12F – a WiFi module
- LF33 – a 3.3 voltage regulator
- a prototype board
- a bunch of cables
- an USB programator – I’am using the FT232 (about $5-6)
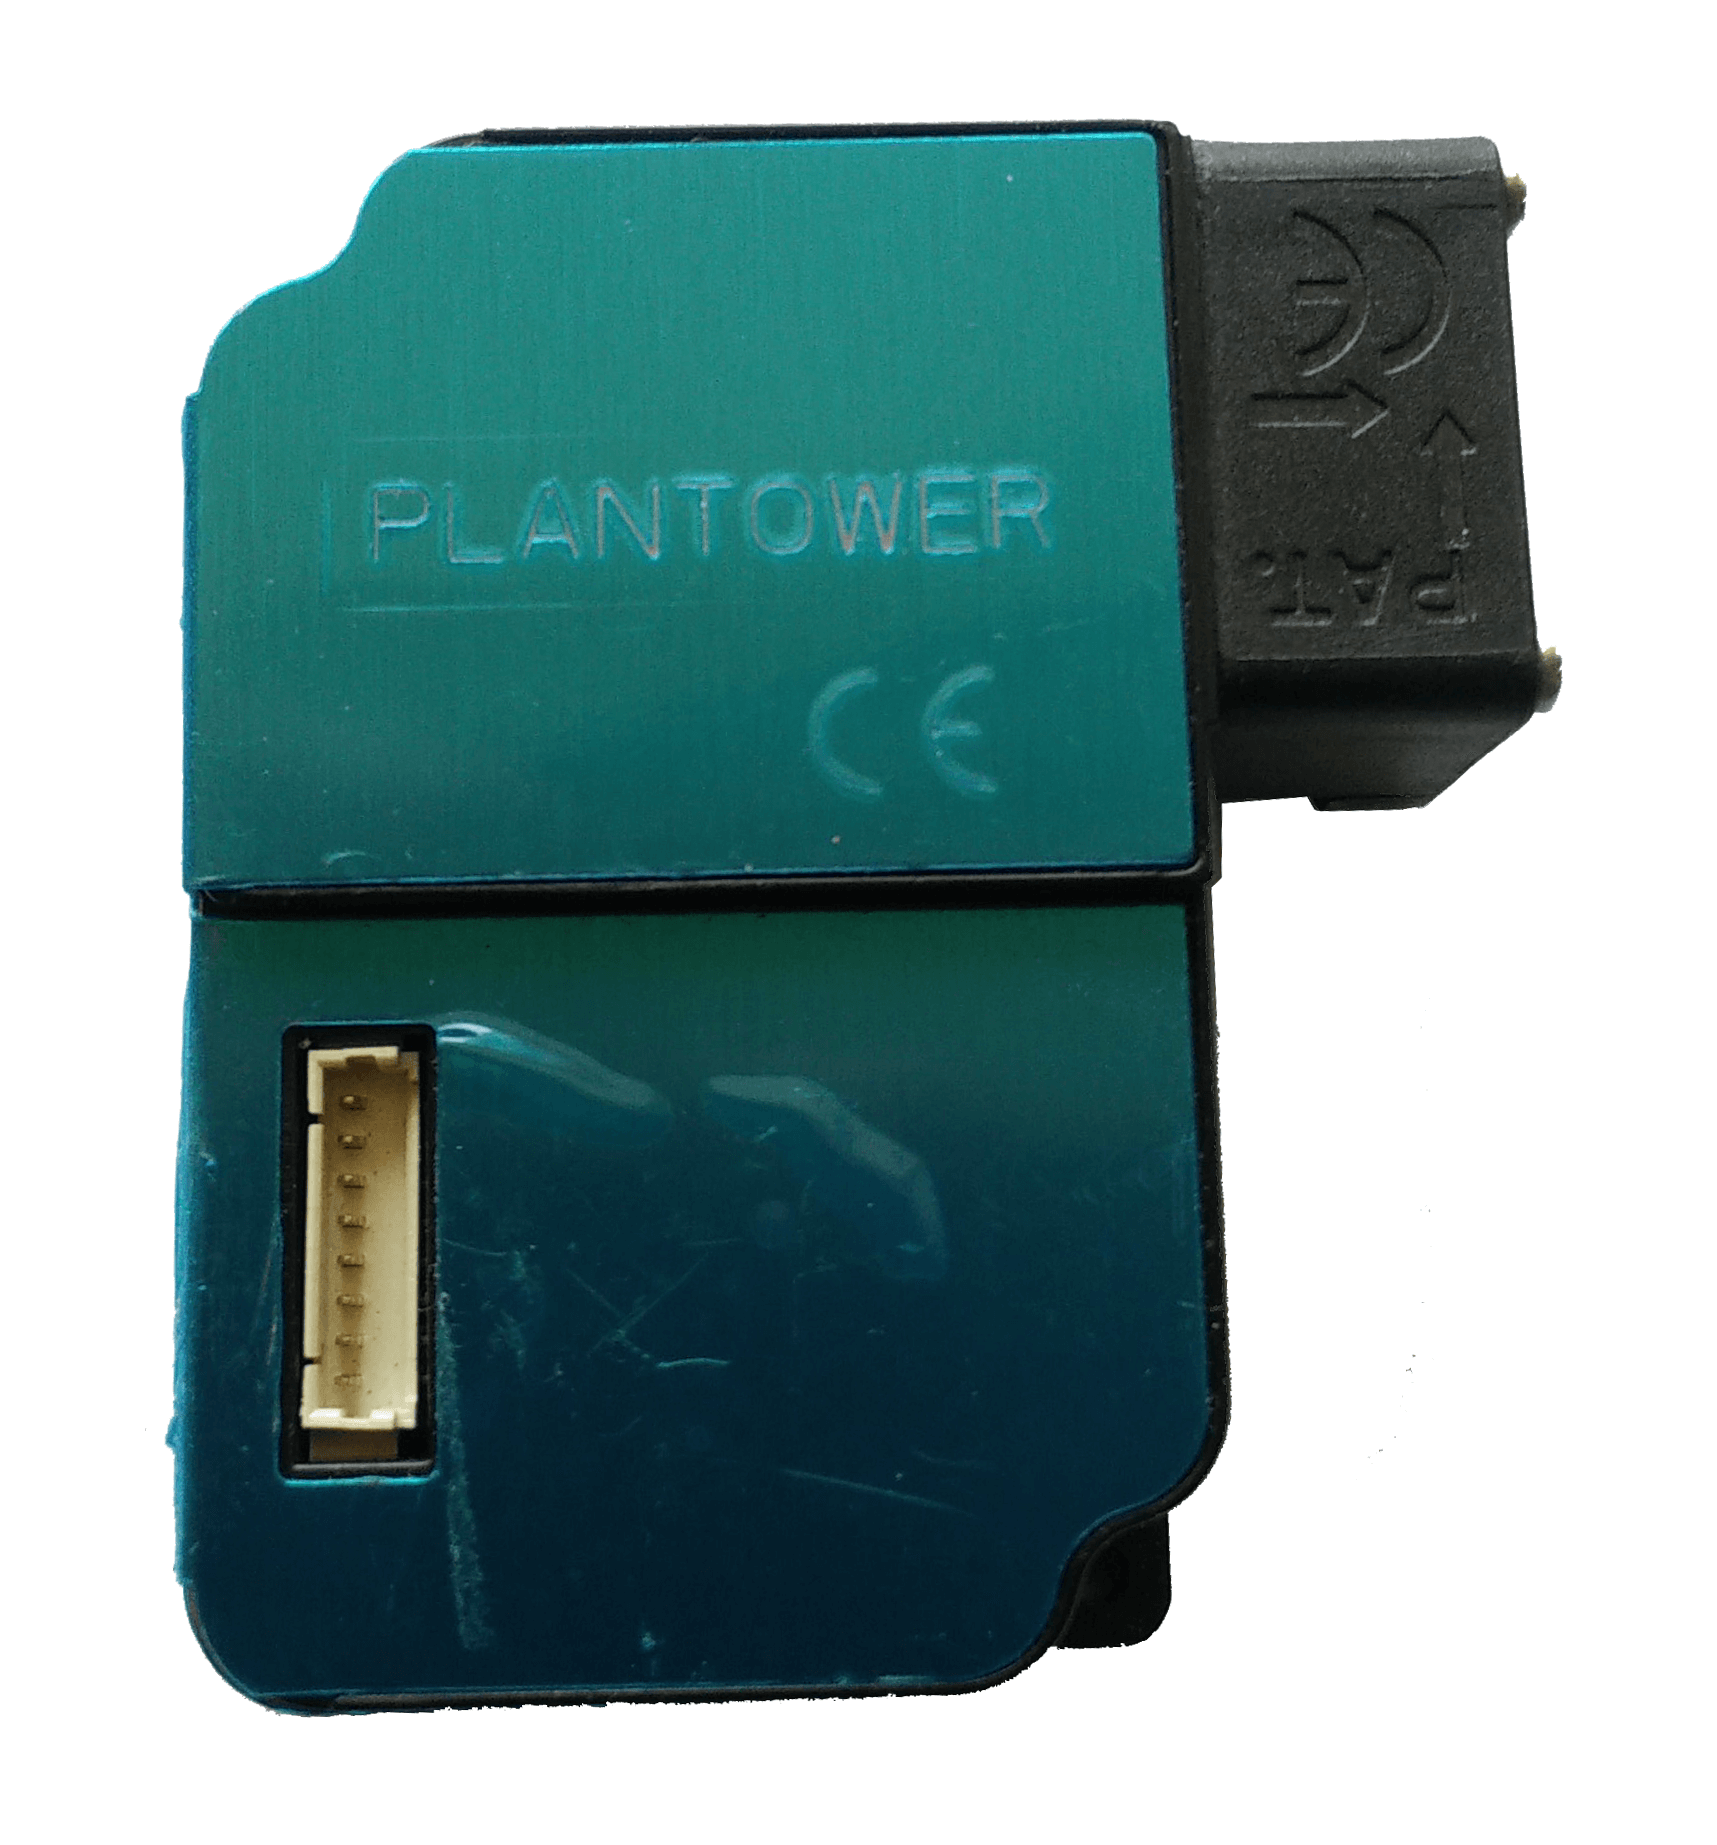
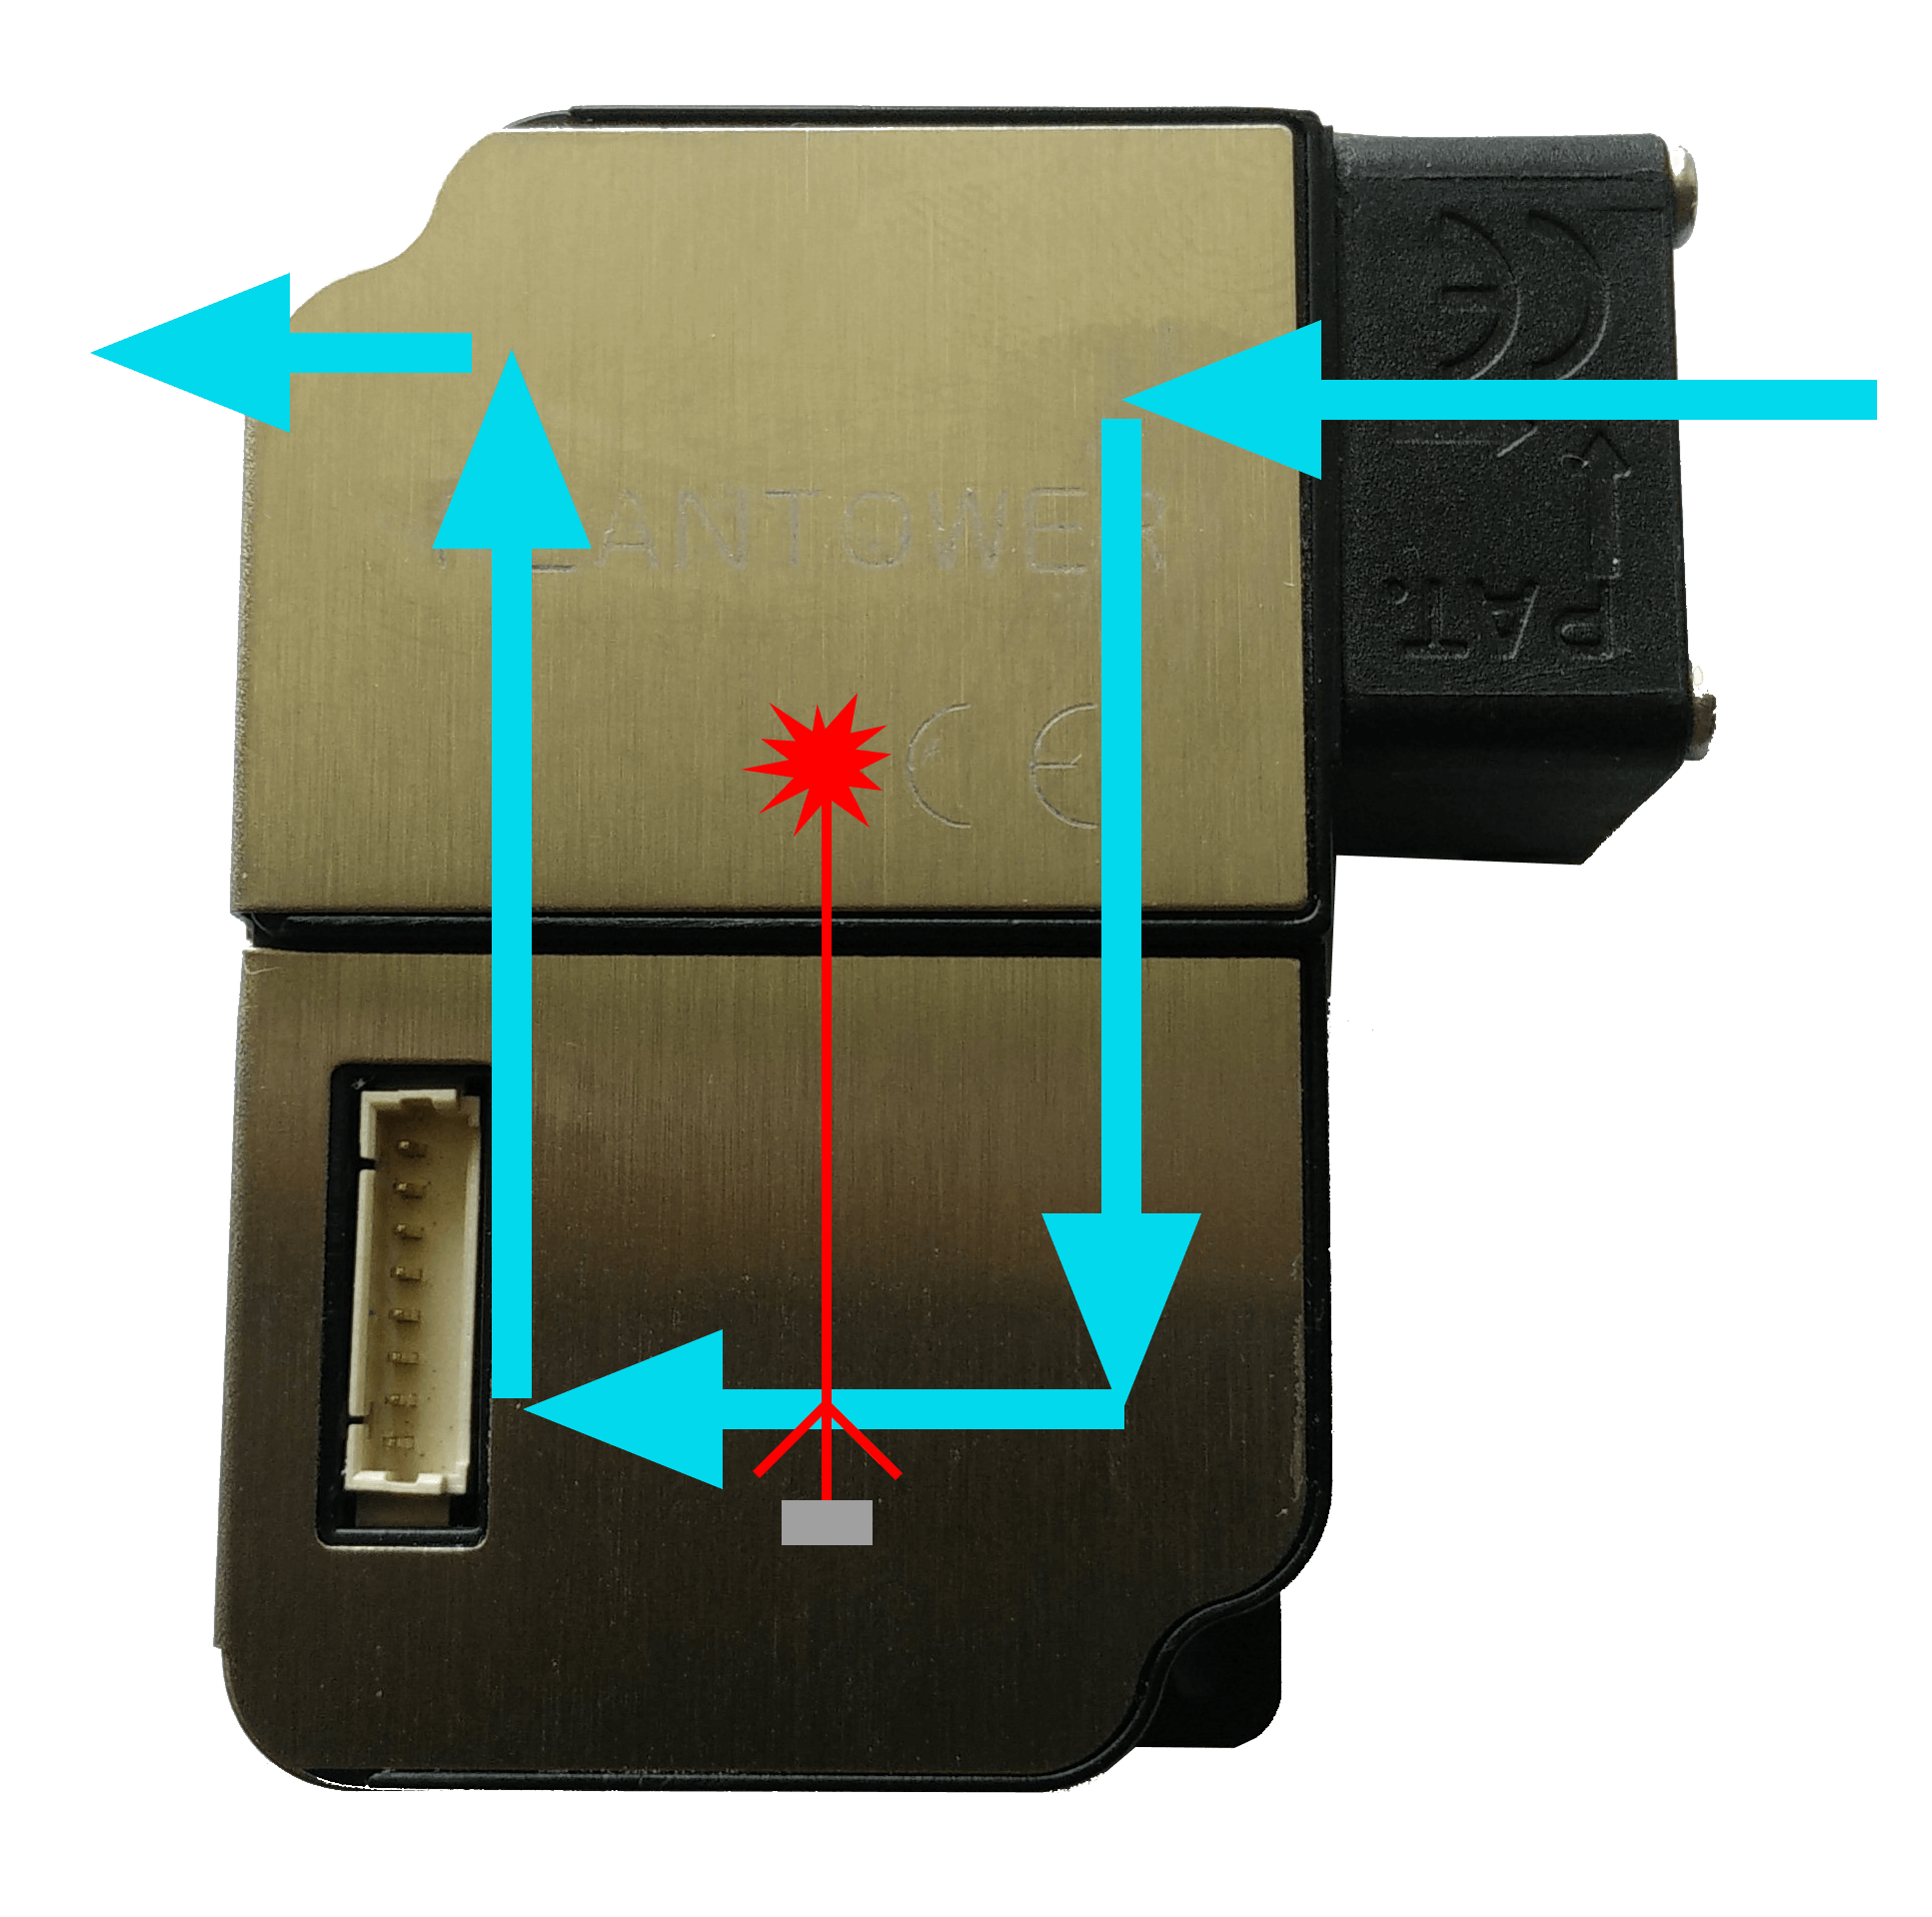
The PM sensor – How does it work?
The sensor use a light scattering process to measure particles. It has a laser diode as a near-infrared source of light. This kind of light is used to avoid interference with the day light. PMS module has a built-in fan which causes an air flow. When particles go through the detecting area the beam is diffracted onto particles along its path. The scattered light of the beam go to the sensor where is transformed into electrical signals which are amplified and processed. Next, the signal waveform is analysed to classify the particles by size.
WiFi connection
ESP modules are often used in IoT projects. They combine simplicity of usage with a low cost. Each module can connect to Wi-Fi 2.4 GHz b/g/n WPA/WPA2 protected networks. They have a integrated low power 32-bit MCU, 10-bit ADC and TCP/IP protocol stack. I worked with ESP modules earlier and I noticed that there is a lot of information and tutorials about how to use them which is really helpful. You can find many version of the ESP. In general the main difference is they have a various number of outputs. I chose to buy a few ESP-12 modules because I wanted to use an analog input in another project.
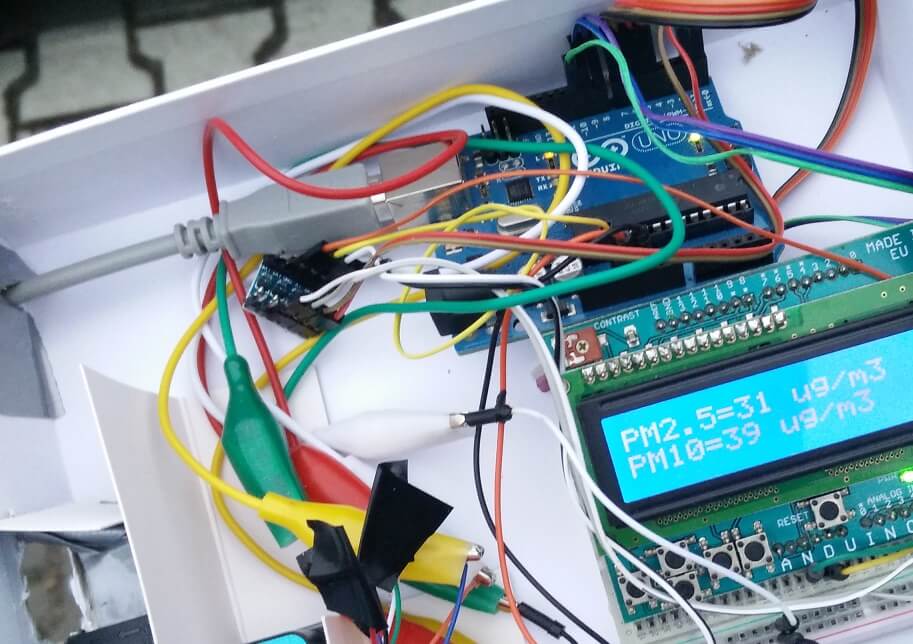
First test
The first delivered package contained the air quality sensor. I wanted to know if the sensor worked properly, before WiFi modules arrived. To do that I just connect it to Arduino and LCD.
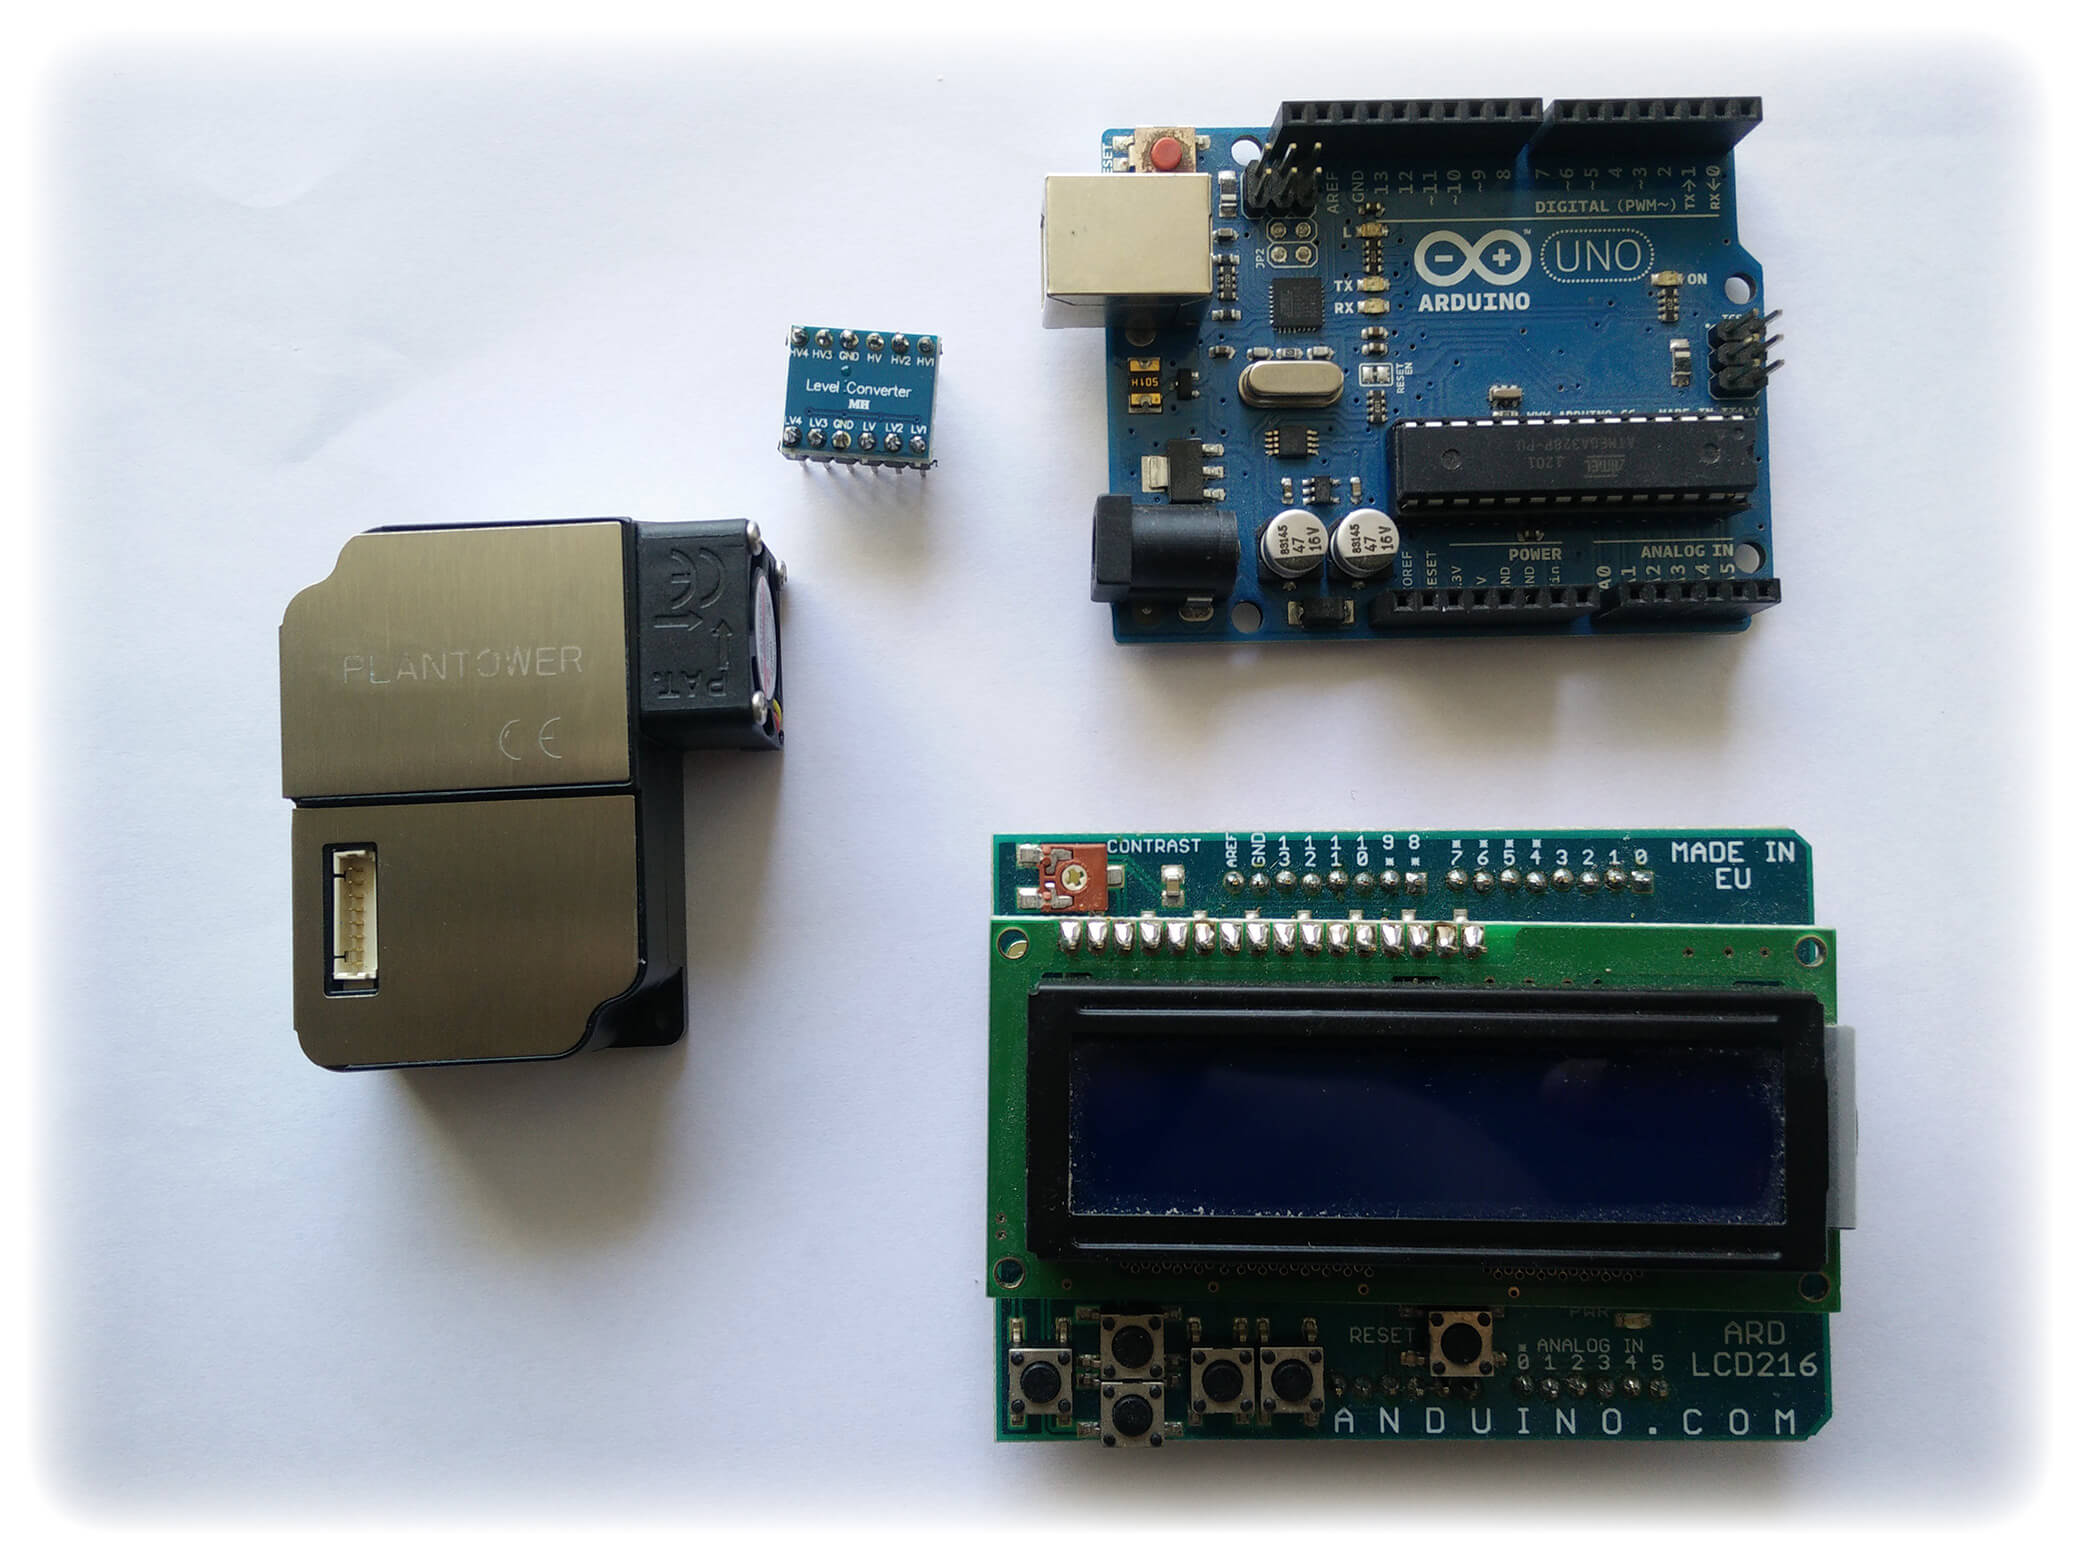
Parts
- PMS3003
- Arduino UNO R3 (ATmega328)
- LCD shield 2X16
- Logic level converter (5V <-> 3.3V) *
* Arduino based on 5V logic. PMS3003 require 5V for power, but the working voltage is 3.3V. That’s why I needed logic level converter.
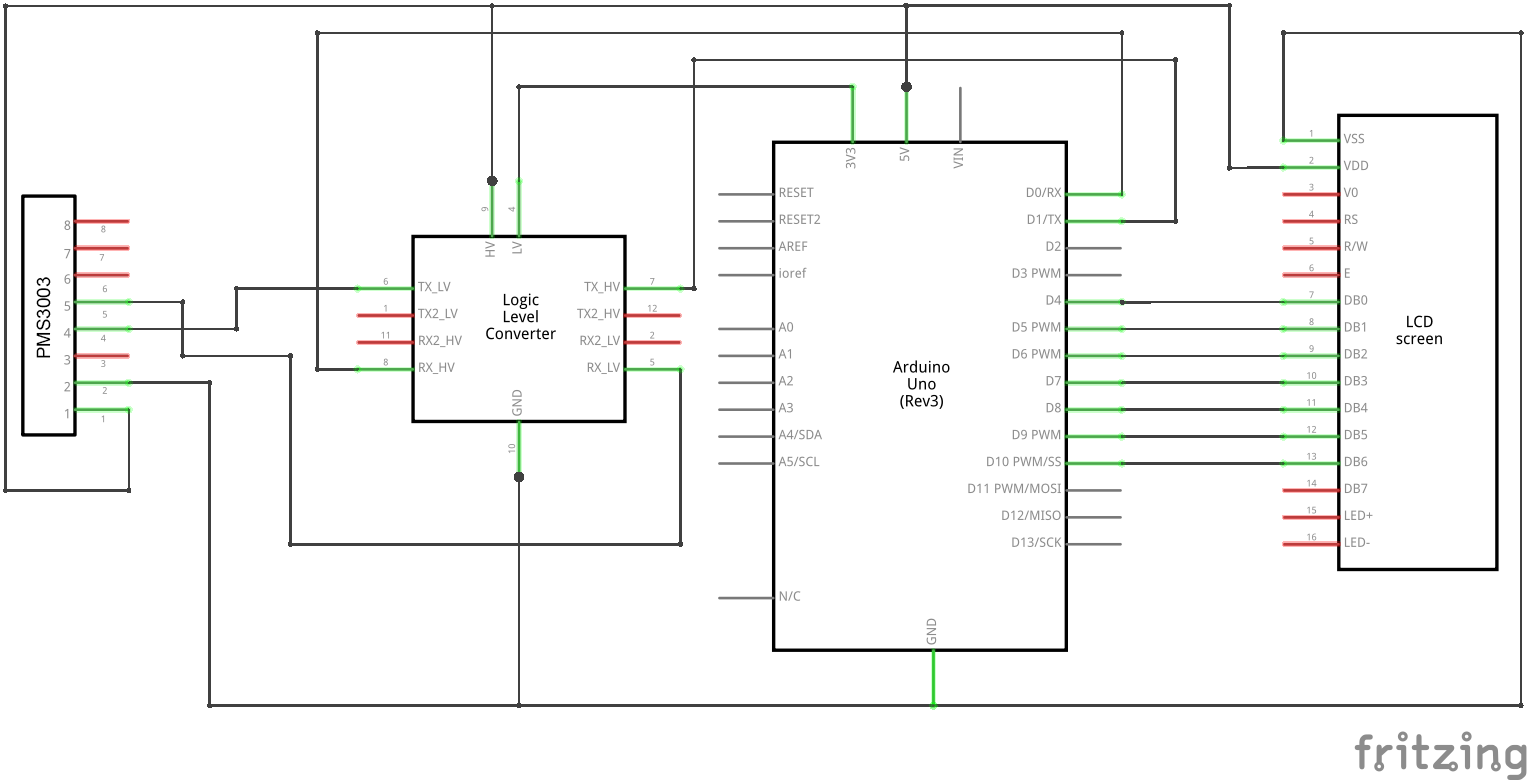
Connections
The PMS3003 sensor use the UART protocol, so I only need to connect RX/TX with TX/RX via the Logical level converter. Sensor’s power is provided from Arduino’s 5V pin.

Schema
Below you can find the full connection schema.
Code
The idea is simple – the program reads values of PM2.5 and PM10 from the sensor and then display them on the screen. To read values we should seek for 0x42 0x4d sequence of bytes. When we find them next bytes will have values we are looking for. Below you can find a table with schema of sensor’s data frame.
| Byte | buffer index | Description |
| 1 | – | Constant value (0x42) |
| 2 | 0 | Constant value (0x4d) |
| 3 | 1 | Frame length |
| 4 | 2 | |
| 5 | 3 | PM1.0 concentration unit (μg/m3) |
| 6 | 4 | |
| 7 | 5 | PM2.5 concentration unit (μg/m3) |
| 8 | 6 | |
| 9 | 7 | PM10 concentration unit (μg/m3) |
| 10 | 8 | |
| 11 | 9 | PM1.0 concentration unit under atmospheric environment (μg/m3) |
| 12 | 10 | |
| 13 | 11 | PM2.5 concentration unit under atmospheric environment (μg/m3) |
| 14 | 12 | |
| 15 | 13 | PM10 concentration unit under atmospheric environment (μg/m3) |
| 16 | 14 | |
| 17 | 15 | reserved |
| 18 | 16 | |
| 19 | 17 | reserved |
| 20 | 18 | |
| 21 | 19 | reserved |
| 22 | 20 | |
| 23 | 21 | Control sum |
| 24 | 22 |
The program is listed below. Most important parts:
- Line 10 – function that checks a sum control
- Line 39 – frame’s first byte detection
- Line 43 – second byte check
- Lines 47,48 – read PM values
#include <LiquidCrystal.h>
#include <stdio.h>
#define N 23

char line1[16], line2[16];
unsigned char buffer [N];
int PM25 = 0, PM10 = 0;
LiquidCrystal lcd(8, 9, 4, 5, 6, 7);

bool checkValue(unsigned char *buf, int length)
{
  bool flag=0;
  int sum=0;

  for(int i=0; i<(length-2); i++)
  {
    sum+=buf[i];
  }
  sum=sum + 0x42;

  if(sum == ((buf[length-2]<<8)+buf[length-1]))
  {
    sum = 0;
    flag = 1;
  }
  return flag;
}

void setup() {
   Serial.begin(9600);

   lcd.begin(16,2);
   lcd.setCursor(0,0);
}

void loop() {

  char fel = 0x42;
  if(Serial.find(&fel, 1)) {
    Serial.readBytes(buffer,N);
  }

  if(buffer[0] == 0x4d)
  {
    if(checkValue(buffer,N))
    {
        PM25=((buffer[5]<<8) + buffer[6]);
        PM10=((buffer[7]<<8) + buffer[8]);

		// rest of values (if you want to use it)
        //PM1=((buffer[3]<<8) + buffer[4]);
        //PM1a=((buffer[9]<<8) + buffer[10]);
        //PM25a=((buffer[11]<<8) + buffer[12]);
        //PM10a=((buffer[13]<<8) + buffer[14]);
    }
  }

  lcd.clear();
  lcd.setCursor(0,0);

  sprintf(line1,"PM2.5=%d ug/m3",PM25);
  lcd.print(line1);
  lcd.setCursor(0,1);

  sprintf(line2,"PM10=%d ug/m3",PM10);
  lcd.print(line2);

}
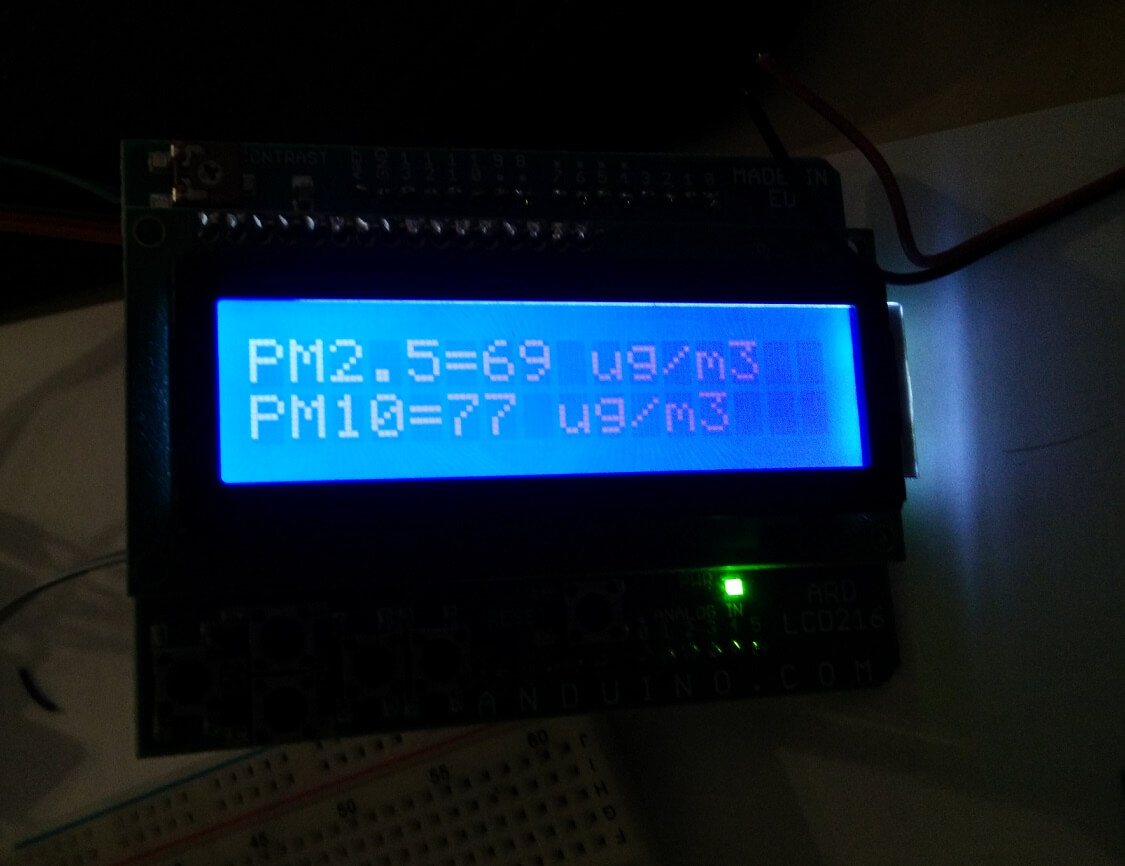
Measurement
Below you can find few examples of measurements just to show you how much the air in Poland can be polluted.

Leave a Reply